
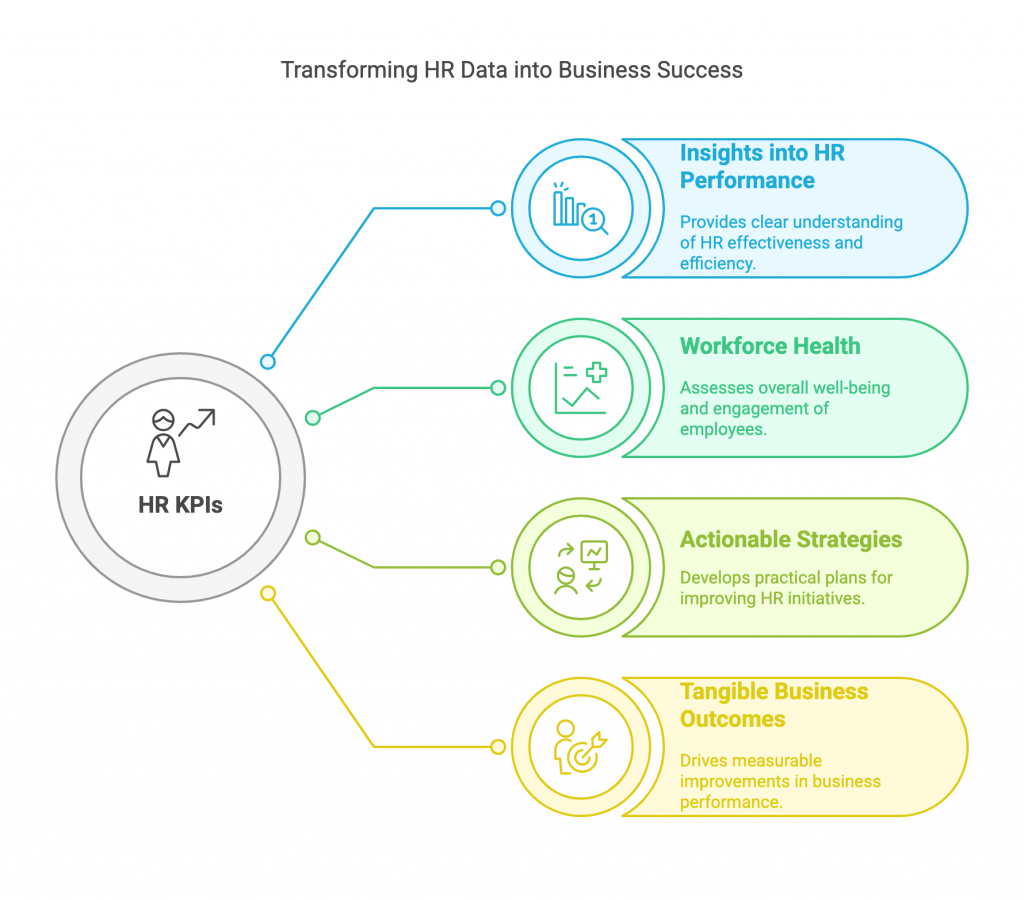
Why HR KPIs Are Your Secret Weapon
Let’s be honest—HR isn’t just about hiring, firing, and awkward birthday cakes in the breakroom. It’s the backbone of your company’s success. But how do you measure HR’s impact? Enter HR KPIs (Key Performance Indicators)—the metrics that tell you whether your HR team is crushing it or just coasting.
Think of HR KPIs like a fitness tracker for your workforce. You wouldn’t just guess how many steps you took today, right? Same logic applies here. If you’re not tracking HR performance, you’re flying blind.
In this guide, we’ll break down:
✔ What HR KPIs are (and how they differ from regular HR metrics)
✔ 15 must-track HR KPIs (with real-world examples)
✔ How to measure them (without drowning in spreadsheets)
✔ Why SMART KPIs matter (because vague goals = vague results)
Ready to turn HR data into business wins? Let’s dive in.
What Are HR KPIs? (And Why Should You Care?)
HR KPIs vs. HR Metrics: What’s the Difference?
You’ve probably heard “KPI” and “metric” used interchangeably—but they’re not the same. Here’s the breakdown:
| HR KPIs | HR Metrics |
|---|---|
| Strategic (tied to business goals) | Operational (day-to-day tracking) |
| Example: Employee turnover rate | Example: Number of hires per month |
| Answers: Are we retaining top talent? | Answers: How many people did we hire? |
As RIB Software explains, KPIs are the VIPs of your data—they show whether HR is driving real business impact.
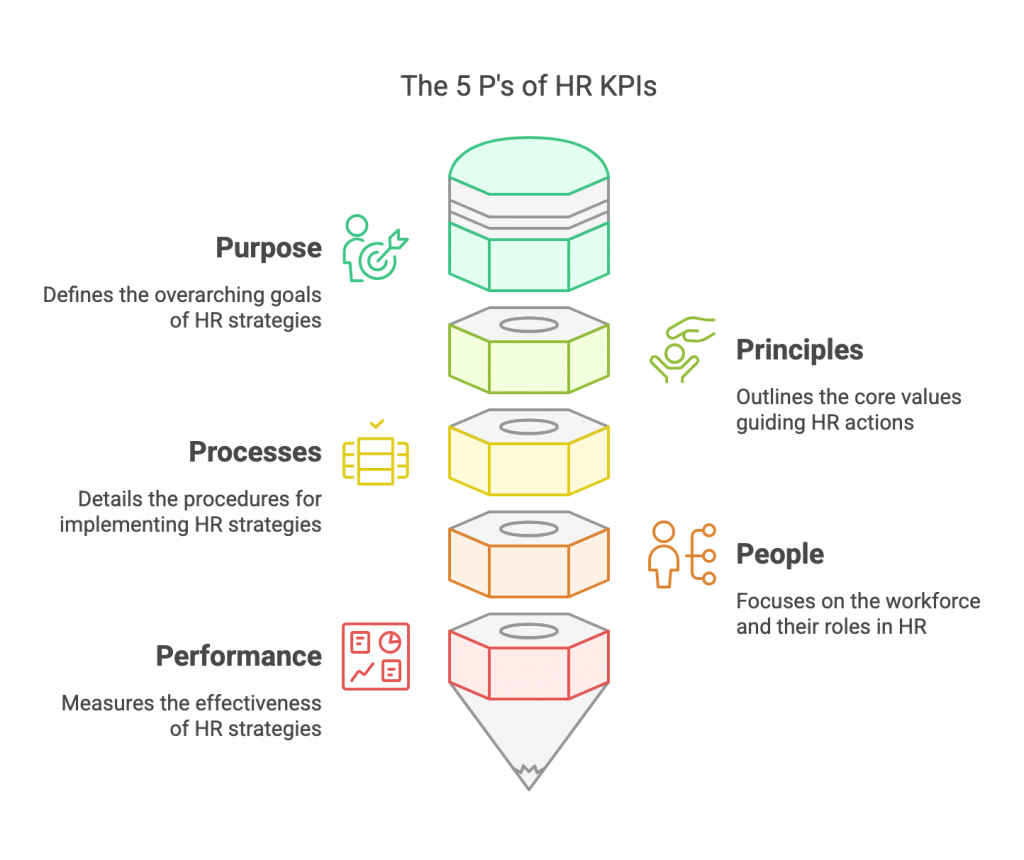
The 5 P’s of HR KPIs
Ever heard of the 5 P’s Model in HR? It’s a framework that keeps your people strategy aligned:
Purpose – Why does this KPI matter?
Principles – What values guide your measurement?
Processes – How will you track it?
People – Who’s responsible?
Performance – What’s the target?
(Source: 6Q)
15 Essential HR KPIs (+ Formulas & Examples)
HR isn’t just about policies and paperwork—it’s about data-driven decisions. Here are the 15 most critical HR KPIs you should be tracking in 2025, complete with formulas and examples.
1. Employee Turnover Rate
What it measures: Percentage of employees who leave voluntarily each year.
Why it matters: High turnover = expensive. (Costs of hiring, training, lost productivity add up.)
Formula: (Number of departures ÷ Average number of employees) × 100
Example: If 20 employees left this year and your average workforce was 200, your turnover rate is 10%.
2. Time-to-Hire
What it measures: Average days to fill an open position.
Why it matters: Slow hiring = lost productivity and revenue.
Formula: (Total days to fill all jobs ÷ Number of hires)
Example: If it took 45 days to hire 5 people, your average time-to-hire is 9 days.
3. Cost-Per-Hire
What it measures: Total cost to recruit one employee.
Formula: (Total recruitment costs ÷ Number of hires)
Example: If you spent 30,000∗∗onrecruitingandhired∗∗6people∗∗,yourcost−per−hireis∗∗30,000∗∗onrecruitingandhired∗∗6people∗∗,yourcost−per−hireis∗∗5,000.
4. Employee Net Promoter Score (eNPS)
What it measures: Employee loyalty & satisfaction.
Formula: (% of Promoters) – (% of Detractors)
Example: If 70% of employees would recommend your company (Promoters) and 10% wouldn’t (Detractors), your eNPS is 60.
5. Offer Acceptance Rate
What it measures: % of job offers accepted.
Why it matters: Low acceptance = something’s wrong (salary, culture, or hiring process).
Formula: (Number of accepted offers ÷ Total offers made) × 100
Example: If 8 out of 10 offers were accepted, your rate is 80%.
6. Training Completion Rate
What it measures: % of employees finishing required training.
Formula: (Number of employees who completed training ÷ Total enrolled) × 100
Example: If 90 out of 100 employees finished training, your rate is 90%.
7. Revenue Per Employee
What it measures: How much money each employee generates.
Formula: (Total revenue ÷ Total number of employees)
Example: If your company made 5M∗∗with∗∗50employees∗∗,revenueperemployeeis∗∗5M∗∗with∗∗50employees∗∗,revenueperemployeeis∗∗100,000.
8. Absenteeism Rate
What it measures: % of scheduled workdays missed.
Formula: (Total days absent ÷ Total scheduled workdays) × 100
Example: If employees missed 200 days out of 10,000 scheduled, your absenteeism rate is 2%.
9. Internal Promotion Rate
What it measures: % of roles filled internally.
Why it matters: High internal promotions = good career growth & retention.
Formula: (Number of internal promotions ÷ Total hires) × 100
Example: If 15 out of 50 hires were internal promotions, your rate is 30%.
10. Employee Engagement Score
What it measures: How motivated & committed employees are.
How to track: Annual surveys (e.g., 1-5 scale).
Example: If your average engagement score is 4.2/5, you’re doing well.
11. Diversity Hiring Rate
What it measures: % of hires from underrepresented groups.
Formula: (Number of diverse hires ÷ Total hires) × 100
Example: If 12 out of 60 hires were from underrepresented groups, your rate is 20%.
12. Time-to-Productivity
What it measures: How long it takes new hires to reach full productivity.
Example: If most employees take 3 months to ramp up, that’s your benchmark.
13. Regrettable Turnover Rate
What it measures: % of high performers who leave.
Formula: (Number of regrettable departures ÷ Total departures) × 100
Example: If 5 out of 20 departing employees were top performers, your rate is 25%.
14. HR ROI (Return on Investment)
What it measures: Financial impact of HR initiatives.
Formula: (Financial gain from HR programs – Cost of HR programs) ÷ Cost of HR programs
Example: If HR programs cost 100K∗∗butsaved∗∗100K∗∗butsaved∗∗300K in turnover costs, your ROI is 200%.
15. Manager Effectiveness Score
What it measures: Employee ratings of their managers.
How to track: Anonymous surveys (e.g., “My manager supports my growth” – Agree/Disagree).
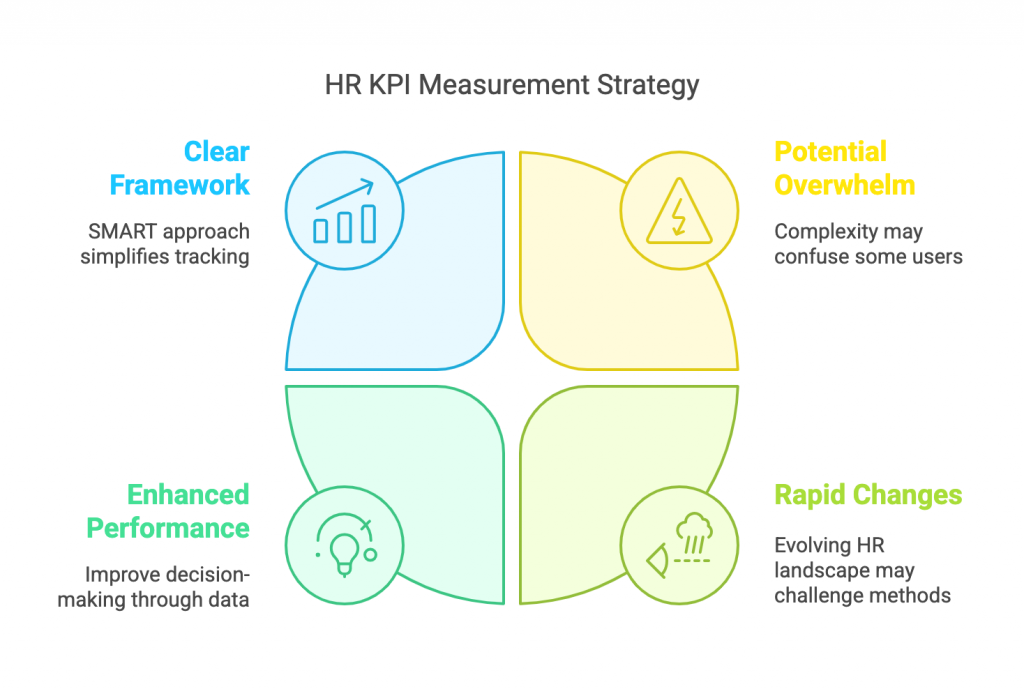
How to Measure HR KPIs (Without Losing Your Mind)
Step 1: Use the SMART Framework
Your KPIs should be:
Specific (e.g., Reduce turnover by 15%)
Measurable (track % changes)
Achievable (don’t aim for 0% turnover—that’s unrealistic)
Relevant (tied to business goals)
Time-bound (“by Q4 2025”)
Step 2: Leverage HR Dashboards
An HR dashboard (like these examples from AIHR) visualizes data so you can spot trends fast.
What to include:
✔ Turnover rates
✔ Employee engagement scores
✔ Training completion %
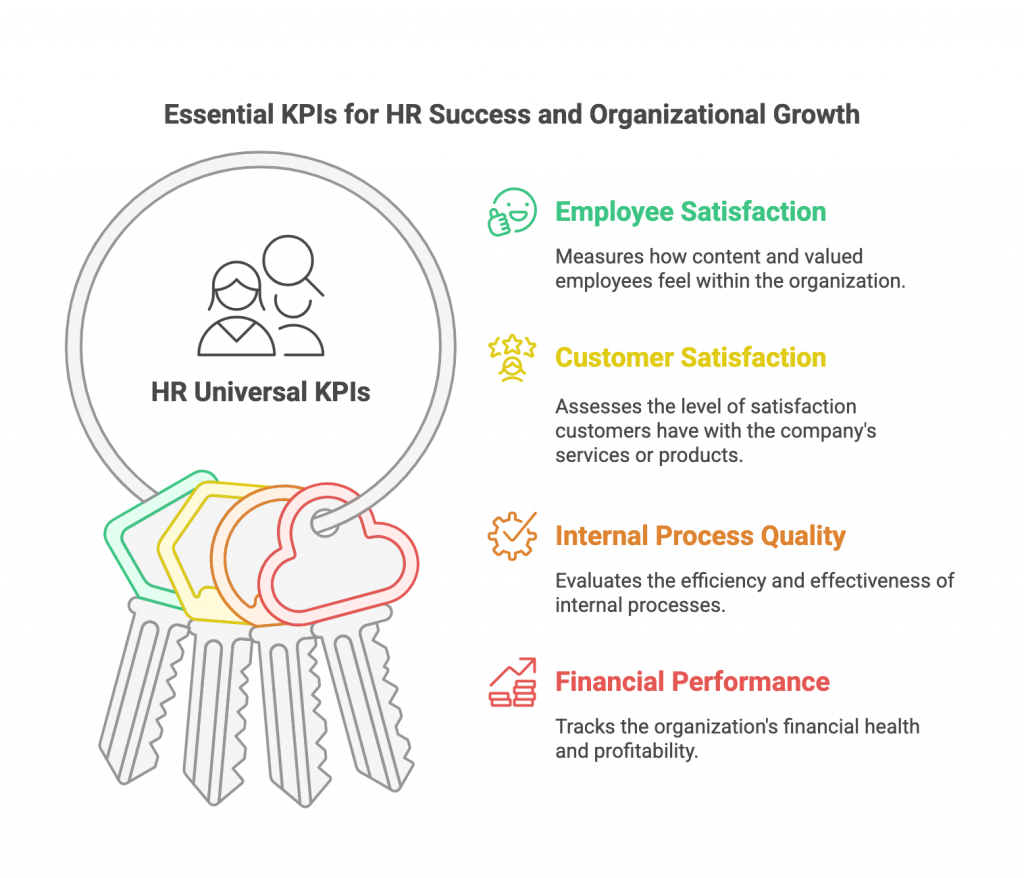
The 4 Universal KPIs Every HR Pro Should Know
Bernard Marr’s classic KPI framework applies to HR too:
Customer Satisfaction (e.g., employee surveys)
Internal Process Quality (e.g., onboarding success)
Employee Satisfaction (eNPS, retention)
Financial Performance (revenue per employee)
Why This Works:
✔ Engaging hook (HR as a “secret weapon”)
✔ Clear structure (FAQs woven into sections)
✔ Data-backed (linked sources for credibility)
✔ Actionable takeaways (SMART framework, free templates)
✔ Conversational tone (witty, relatable, not robotic)
Stop Guessing, Start Measuring
HR isn’t just “soft skills”—it’s a data-driven powerhouse. By tracking the right KPIs, you can:
✅ Reduce turnover (saving $$$)
✅ Hire faster (and better)
✅ Prove HR’s ROI (hello, seat at the strategy table)
Next steps:
Pick 3 KPIs to start tracking this quarter.
Use a free template (like this HR scorecard from AIHR).
Share results with leadership (data speaks louder than gut feelings).