
Here’s a funny thing about being an HR professional in 2025: while we’re all about the “human” element of Human Resources, our executive teams want cold, hard numbers. And you know what? They’re right to ask for them. I learned this lesson the hard way during my first executive presentation when I came armed with feelings and feedback instead of figures. The silence in that room was deafening.
But don’t worry – I’m here to help you avoid that awkward moment. Let’s dive into the HR metrics that will make your executive team sit up and take notice, and more importantly, understand the true value HR brings to the organization.
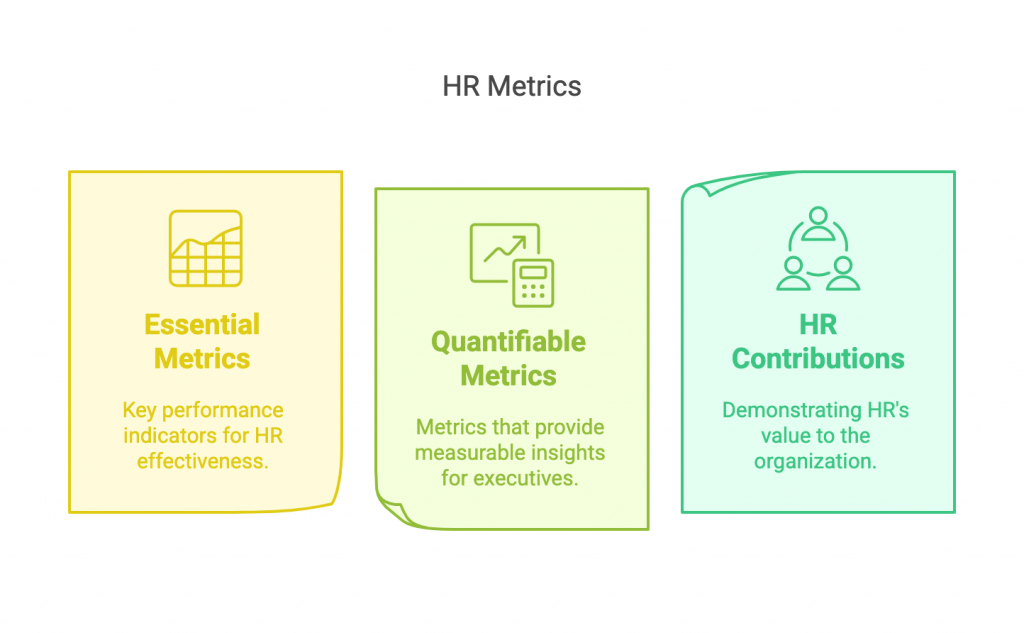
Why HR Metrics Matter More Than Ever
Remember when HR was just about hiring and firing? Those days are long gone. In today’s data-driven business world, HR metrics have become crucial indicators of organizational health and performance. They’re not just numbers – they’re stories about your company’s most valuable asset: its people.
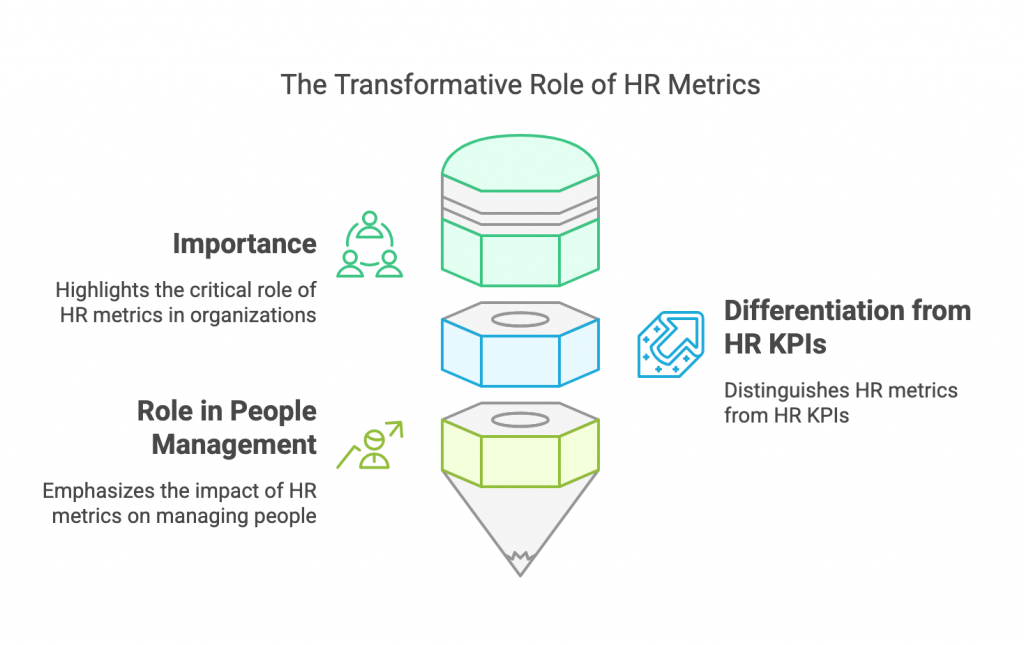
Before we dive into the specific metrics, let’s address a question I often hear: “What’s the difference between HR metrics and HR KPIs?” Think of metrics as all the data points you can measure, while KPIs (Key Performance Indicators) are the specific metrics you’ve chosen to track because they align with your strategic goals. It’s like having a closet full of clothes (metrics) but knowing which outfits (KPIs) are perfect for specific occasions.
The Magnificent Seven: HR Metrics Your Executive Team Cares About
1. Revenue Per Employee (RPE)
This is the heavy hitter of HR metrics. Your executive team loves this one because it directly ties to the bottom line.
How to Calculate:
Revenue Per Employee = Total Revenue / Total Number of Full-Time EmployeesWhy Executives Care: Think of RPE as your company’s efficiency score. It tells executives how well you’re utilizing your human capital to generate revenue. I once worked with a tech startup that increased their RPE by 23% after implementing targeted training programs – needless to say, the executive team was thrilled.
Pro Tip: Track this quarterly to identify trends and seasonality in your business.
2. Employee Turnover Rate
This isn’t just about how many people are leaving – it’s about the cost and impact of those departures.
How to Calculate:
Turnover Rate = (Number of Separations / Average Number of Employees) x 1Why Executives Care: Every time an employee walks out the door, they take their knowledge with them and leave a bag of recruitment and training costs behind. But here’s what really gets executives’ attention: breaking down turnover costs:
| Cost Category | Average Cost (% of Annual Salary) |
|---|---|
| Recruitment | 15-25% |
| Training | 20-30% |
| Lost Productivity | 40-50% |
| Cultural Impact | 10-20% |
3. Time to Fill Critical Positions
In today’s fast-moving business environment, every day a key position remains empty is a day of lost opportunity.
How to Calculate:
Time to Fill = Date Position Filled - Date Position Opened4. Training ROI
This is where we transform the “cost center” perception of HR into a “value creator” reality.
How to Calculate:
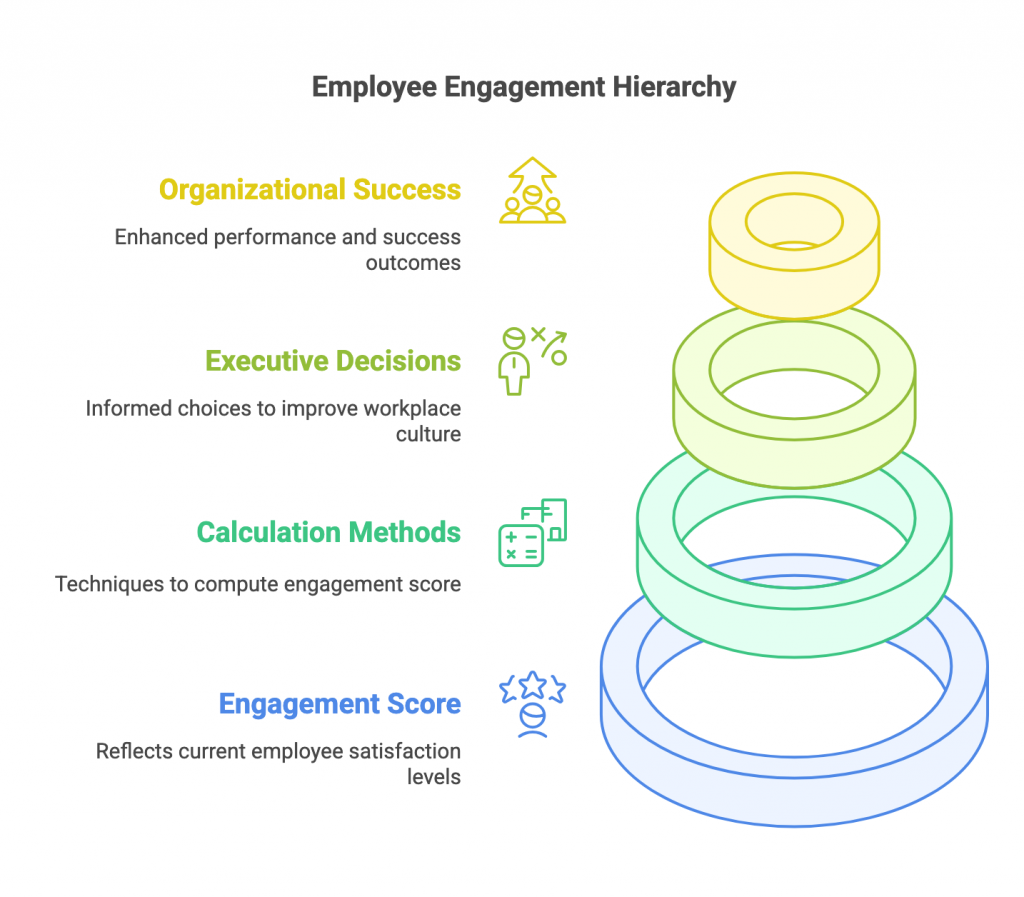
Training ROI = ((Benefits of Training - Cost of Training) / Cost of Training) x 1005. Employee Engagement Score
Now we’re getting into what I call the “smart metrics” – ones that predict future performance rather than just measuring past results.
How to Calculate: Typically measured through standardized surveys with questions rated on a 1-5 scale, focusing on:
- Job satisfaction
- Career development opportunities
- Relationship with management
- Alignment with company values
- Work-life balance
Why Executives Care: Engaged employees are productive employees. More importantly, engagement scores are leading indicators of turnover, productivity, and customer satisfaction.
6. Cost Per Hire
This metric helps executives understand the true investment required to grow the team.
How to Calculate:
Cost Per Hire = (Internal Recruiting Costs + External Recruiting Costs) / Total Number of Hires7. Diversity and Inclusion Metrics
These metrics have moved from “nice to have” to “must have” in recent years.
Key Metrics to Track:
- Demographic representation at all levels
- Pay equity ratios
- Promotion rates across different groups
- Inclusion survey scores
Why Executives Care: Beyond the ethical imperative, diverse companies are proven to be more innovative and profitable. Plus, these metrics are increasingly important to investors and customers alike.
Making These Metrics Work for You
Here’s the secret sauce to making these metrics truly valuable to your executive team:
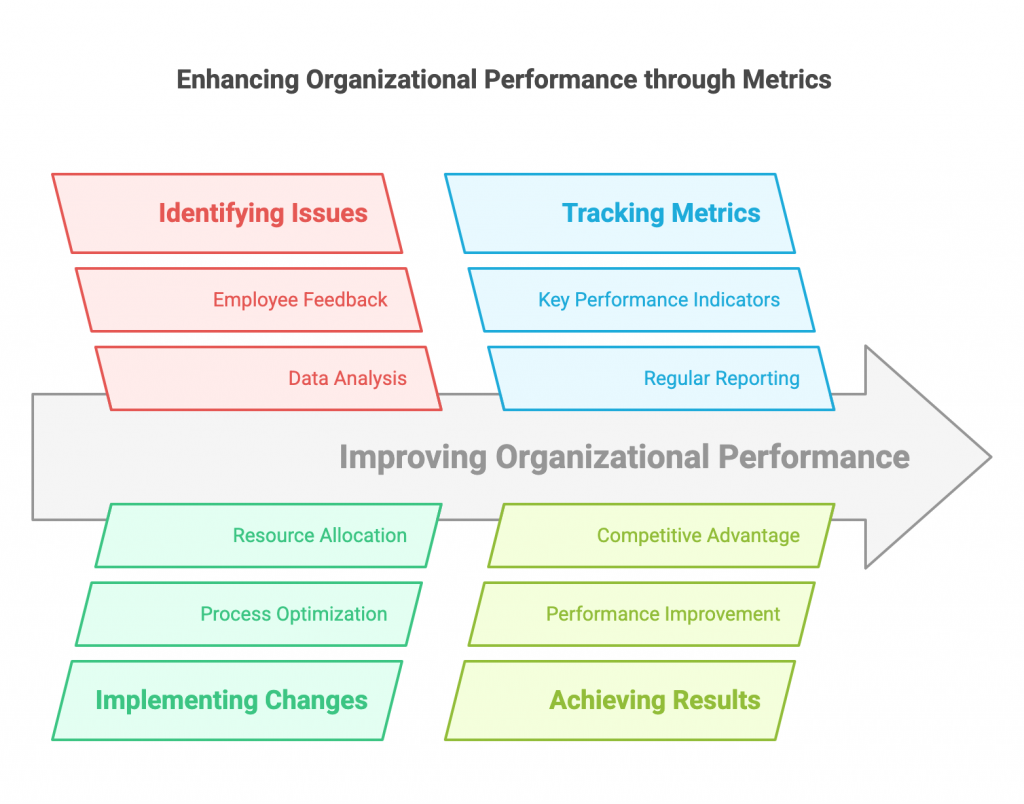
- Context is King Don’t just present numbers – tell the story behind them. If your turnover rate is 15%, explain how it compares to your industry average and what factors are driving it.
- Focus on Trends One-time measurements are interesting, but trends over time are enlightening. Show how metrics have changed over at least four quarters.
- Connect to Business Outcomes Always tie metrics back to business results. For example, show how improved engagement scores correlate with higher customer satisfaction ratings.
- Present Actionable Insights Don’t just identify problems – come with potential solutions. Your executive team will appreciate your proactive approach.
When Metrics Meet Reality: A Case Study
Let me share a quick story. At my previous company, we noticed our revenue per employee was lagging behind industry standards. By diving deeper into our metrics, we discovered that our time to fill critical positions was 40% longer than the industry average, leading to productivity gaps.
We implemented a new recruitment strategy, focusing on building talent pipelines for key positions. The result? We cut our time to fill by half and saw a 15% increase in revenue per employee within two quarters. That’s the power of tracking and acting on the right metrics.
Looking Ahead: The Future of HR Metrics
As we move forward, HR metrics are becoming more sophisticated. We’re seeing the emergence of predictive analytics that can forecast turnover risks before they materialize and AI-powered systems that can measure team dynamics through communication patterns.
The key is to stay adaptable and keep evolving your metrics as your business needs change. Remember, the goal isn’t to track everything – it’s to track what matters.
Your Next Steps
Ready to elevate your HR metrics game? Start with these actions:
- Audit your current metrics and align them with business objectives
- Set up automated tracking systems where possible
- Create a regular reporting schedule
- Develop a narrative around your numbers
- Practice presenting metrics in a business context
Final Thoughts
The right HR metrics can transform how executives view the HR function, moving it from a support role to a strategic partner. As one CEO I worked with put it, “Good HR metrics don’t just tell us what happened – they help us see what’s possible.”
Remember, these metrics are tools, not targets. Use them to inform decisions, spark discussions, and drive improvements, but never let them become the sole focus of your HR strategy.