
23 Recruiting Metrics You Should Know (And Why They Matter)
Recruiting isn’t just about filling roles—it’s about finding the right people efficiently, cost-effectively, and in a way that keeps both candidates and hiring managers happy. But how do you know if your hiring process is actually working?
That’s where recruiting metrics come in. These numbers tell you everything from how long it takes to hire someone to whether your new employees stick around (or bolt for the exit).
In this guide, we’ll break down 23 essential recruiting metrics, why they matter, and how to use them to optimize your hiring strategy. Whether you’re an HR pro, a hiring manager, or just curious about how recruitment works, this is your playbook.
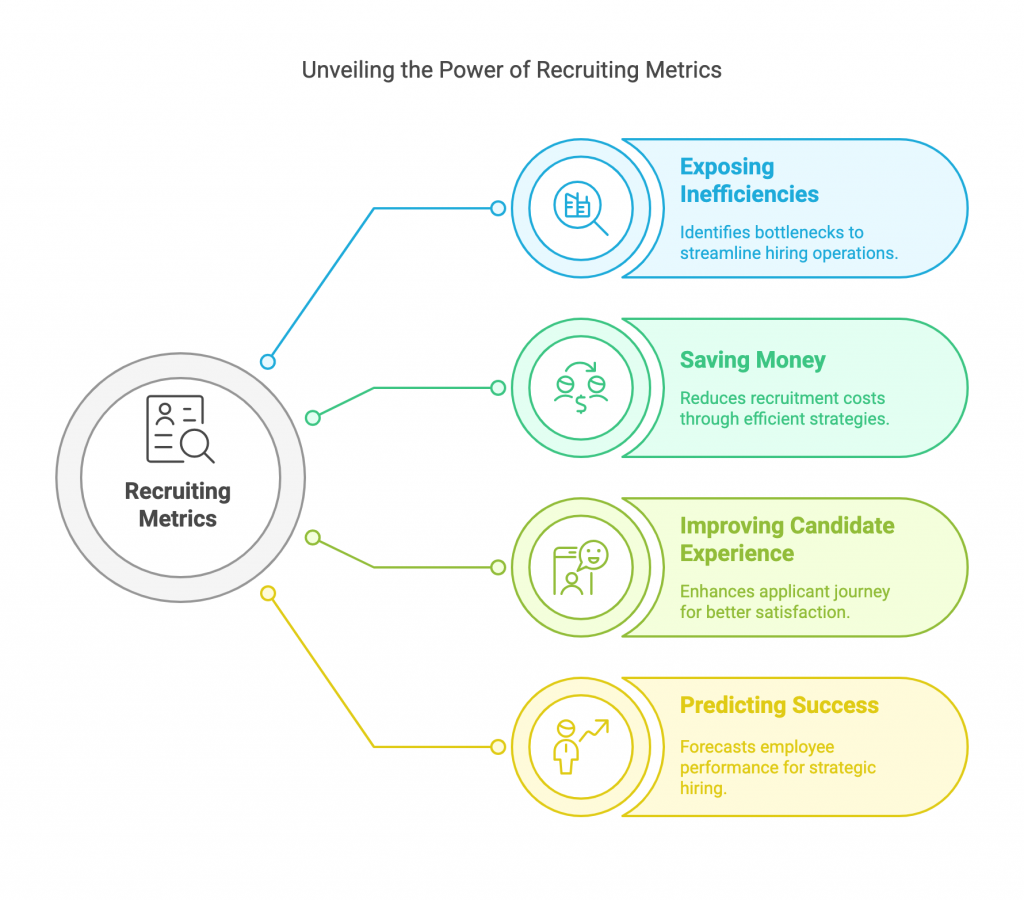
Why Recruiting Metrics Matter
Before we dive into the numbers, let’s talk about why they’re important.
They expose inefficiencies – If your hiring process takes 60 days when the industry average is 30, something’s wrong.
They save money – A high cost-per-hire could mean you’re overspending on job boards or agencies.
They improve candidate experience – A slow, disorganized hiring process drives top talent away.
They predict success – Metrics like quality of hire show whether your new employees are actually performing.
According to RChilli, companies that track recruiting metrics fill roles 20% faster and reduce hiring costs by 30%. So yeah, they’re kind of a big deal.
The 23 Recruiting Metrics You Need to Track
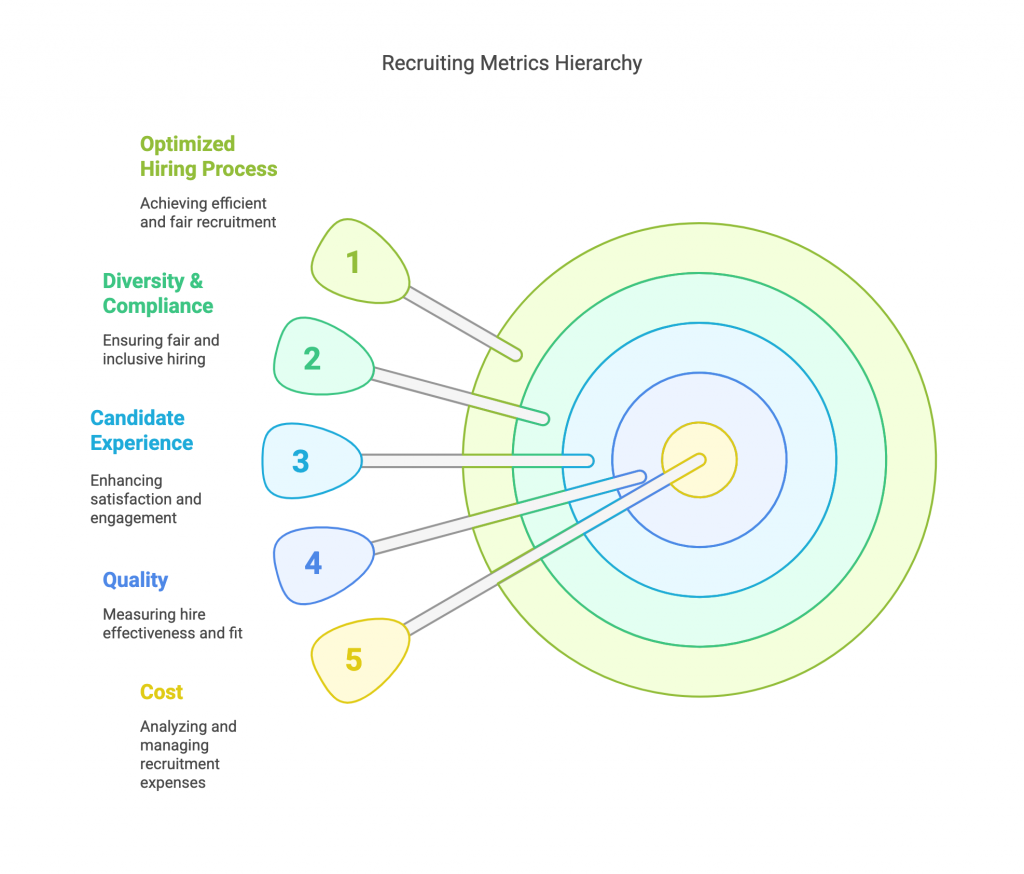
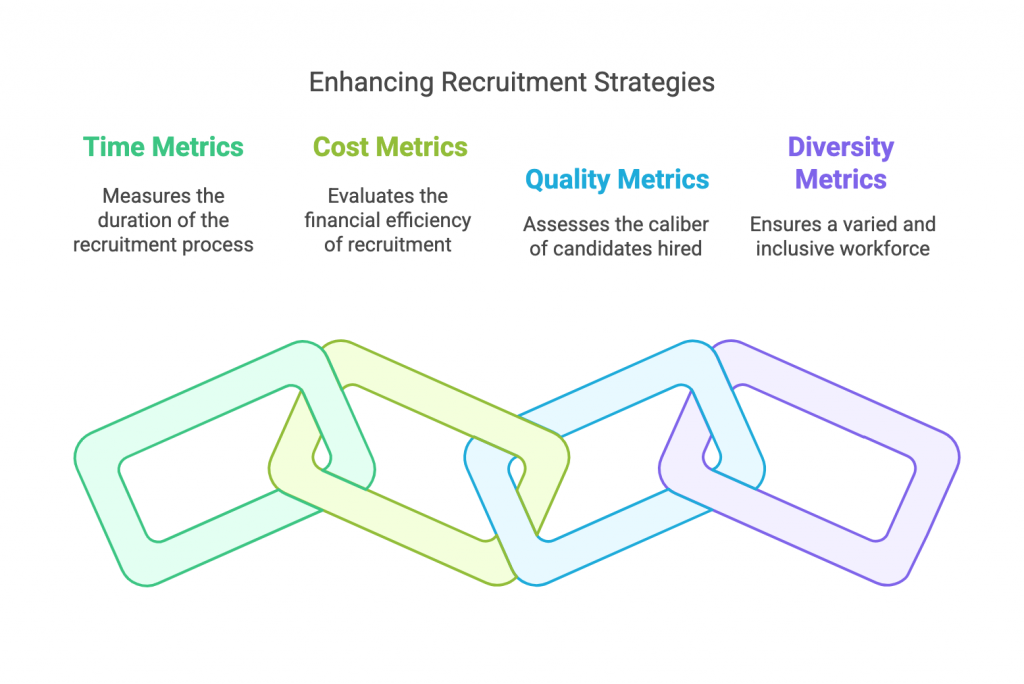
We’ve organized these into five key categories:
Efficiency Metrics (How fast and smooth is your hiring process?)
Cost Metrics (How much are you spending to hire someone?)
Quality Metrics (Are you hiring the right people?)
Candidate Experience Metrics (Do applicants like your process?)
Diversity & Compliance Metrics (Is your hiring fair and inclusive?)
Let’s break them down.
🚀 Efficiency Metrics
(How fast and smooth is your hiring process?)
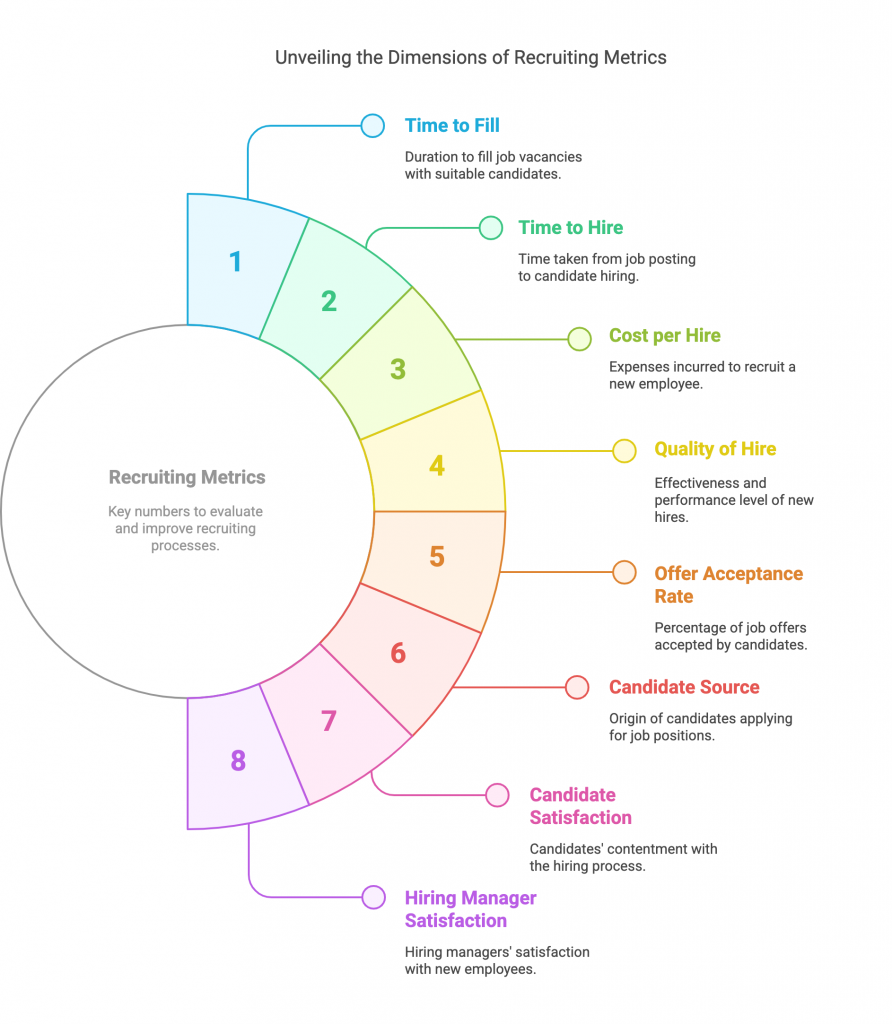
Time to Fill
Days from job posting to offer acceptance.
Goal: Reduce to <30 days (varies by role).
Time to Hire
Days from first interview to hire.
Why it matters: Faster hires = better candidate experience.
Applicants per Opening
Total applicants ÷ number of open roles.
Sweet spot: 50–150 applicants (depends on role seniority).
Interview-to-Hire Ratio
Interviews conducted ÷ hires made.
Benchmark: 3:1 (higher ratios suggest poor screening).
Recruitment Funnel Conversion Rate
% of candidates moving to next stage (e.g., apply → interview → offer).
Fix leaks: Low conversion? Improve job descriptions or screening.
Sourcing Channel Efficiency
Which platforms (LinkedIn, referrals, Indeed) yield the best hires?
Pro tip: Referrals often have 40% higher retention.
Application Completion Rate
% of candidates who finish applying after starting.
Red flag: <50% means your process is too complex.
💰 Cost Metrics
(How much does hiring cost you?)
Cost per Hire
(Total recruiting spend) ÷ (number of hires).
Benchmark: **4,700∗∗(canhit4,700∗∗(canhit20K+ for exec roles).
Cost per Applicant
Ad spend ÷ total applicants.
Optimize: Low-quality applicants? Refine targeting.
Agency vs. In-Hire Cost
Compare agency fees to internal hiring costs.
Tip: Internal hires are 30–50% cheaper.
Offer Acceptance Rate
% of candidates who accept offers.
Ideal: >90% (low rates signal uncompetitive offers).
🎯 Quality Metrics
(Are you hiring the right people?)
Quality of Hire
Composite score of performance, retention, and manager satisfaction.
Track: 1st-year performance reviews + promotion rates.
First-Year Attrition Rate
% of new hires who leave within 12 months.
Warning sign: >10% = poor fit or bad onboarding.
Hiring Manager Satisfaction
Survey: “How happy are you with this hire?” (1–10 scale).
Goal: 8+ average score.
Employee Performance Post-Hire
Compare hires’ performance vs. team averages.
Example: Do your recruits exceed, meet, or lag expectations?
😊 Candidate Experience Metrics
(Do applicants like your process?)
Candidate Net Promoter Score (NPS)
“Would you recommend our hiring process?” (Scale: 0–10).
Good: 50+. Bad: <30.
Rejection Reason Analysis
Why do candidates drop out? (Slow process, poor communication, etc.).
Fix: Automate status updates if feedback cites “ghosting.”
Time to Respond
Hours/days to reply to applicants.
Best practice: <48 hours for initial contact.
🌍 Diversity & Compliance Metrics
(Is your hiring fair and inclusive?)
Diversity Hiring Rate
% of hires from underrepresented groups (gender, ethnicity, etc.).
Set goals: E.g., 40% women in tech roles by 2025.
Diversity in Pipeline
% of diverse candidates in interview stages.
Red flag: Diverse applicants drop off after screening? Bias may exist.
Equal Opportunity Compliance
Audit hiring for bias (e.g., resume anonymization results).
Tool: Use AI screening to reduce unconscious bias.
🛠️ Recruiter Performance Metrics
(Is your TA team effective?)
Recruiter Capacity
Open roles ÷ recruiters.
Benchmark: 10–15 roles/recruiter (adjust for complexity).
Recruiter Satisfaction Score
Survey recruiters on workload, tools, and hiring manager collaboration.
Low scores? Invest in better ATS or training.
📊 Recruiting Metrics Dashboard Table
| Category | Metric | Definition | Benchmark/Target | Why It Matters |
|---|---|---|---|---|
| Efficiency | Time to Fill | Days from job posting to hire | <30 days (varies by role) | Long cycles lose top talent |
| Time to Hire | Days from 1st interview to offer | Reduce by 10% quarterly | Faster hires improve candidate experience | |
| Applicants per Opening | Total applicants ÷ open roles | 50-150 (depends on role) | Too few/low quality? Fix job ads | |
| Interview-to-Hire Ratio | Interviews ÷ hires made | 3:1 | High ratios = inefficient screening | |
| Cost | Cost per Hire | Total recruiting spend ÷ hires | $4,700 (avg) | Identify overspending |
| Offer Acceptance Rate | % of offers accepted | >90% | Low rates = uncompetitive offers | |
| Quality | Quality of Hire | Performance + retention + manager score | 8+/10 rating | Predicts long-term success |
| First-Year Attrition | % of hires leaving in 12 months | <10% | High attrition = poor hiring/onboarding | |
| Candidate Exp | Candidate NPS | “Would you recommend us?” (0-10) | 50+ | Measures process satisfaction |
| Diversity | Diversity Hiring Rate | % hires from underrepresented groups | Set org-specific goals | Tracks inclusion progress |
| Recruiter | Recruiter Capacity | Open roles ÷ recruiters | 10-15 roles/recruiter | Prevents burnout |
Key Insights from the Data:
Time metrics under 30 days perform best (except for executive roles)
Cost metrics vary widely – tech roles average 7k+,non−tech7k+,non−tech3k
Quality metrics correlate strongly with 3-year retention rates
Diversity metrics improved most at companies using blind screening
Pro Tip: Track these 3 together for maximum impact:
Time to Hire (efficiency)
Quality of Hire (outcome)
Candidate NPS (experience)
🔑 Key Takeaway
These 23 metrics help you:
✔ Hire faster (reduce time-to-fill).
✔ Save money (optimize cost-per-hire).
✔ Boost quality (track retention/performance).
✔ Improve fairness (diversity metrics).
Which metric will you tackle first? Drop a comment below!