
12 Productivity Metrics Examples for Working Effectively
(And How to Track Them)
Why Measuring Productivity Matters
Ever feel like you’re working hard but not actually getting anywhere? You’re not alone. In today’s fast-paced work environment, busy ≠ productive.
That’s where productivity metrics come in. These measurable indicators help you (and your team) understand:
What’s working (so you can do more of it).
What’s not (so you can fix it).
How to optimize workflows for better results.
But with so many metrics out there, which ones actually matter? Below, I’ll break down 12 key productivity metrics—with real-world examples—to help you work smarter, not harder.
1. Output Per Hour (Or Per Employee)
What it measures: How much work is completed in a given time.
Example: If a customer service rep handles 50 tickets in an 8-hour shift, their output per hour is 6.25 tickets/hour.
Why it matters: Identifies top performers and bottlenecks.
Best for: Manufacturing, sales, customer support.
“Output per hour is the bread and butter of productivity tracking—it’s simple but powerful.” — Mosaic
2. Revenue Per Employee
What it measures: How much money each employee generates.
Formula: Total Revenue ÷ Number of Employees
Example: A startup with 1Mrevenueand10employees∗∗=∗∗1Mrevenueand10employees∗∗=∗∗100K per employee.
Why it matters: Shows if your team is scaling efficiently.
(Pro Tip: Compare this to industry benchmarks—tech companies average $200K+ per employee.)
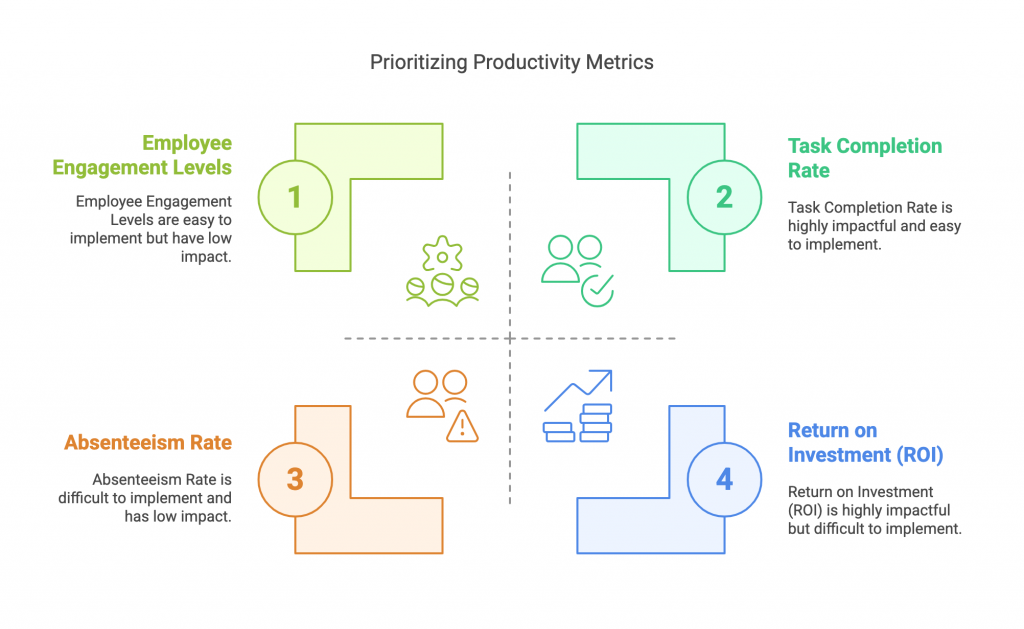
3. Task Completion Rate
What it measures: Percentage of tasks finished on time.
Example: A developer completes 18 out of 20 assigned tasks this week → 90% completion rate.
Why it matters: Uncovers workflow inefficiencies.
| Role | High Performance | Needs Improvement |
|---|---|---|
| Marketing Manager | 85%+ | Below 70% |
| Software Engineer | 90%+ | Below 75% |
4. Time to Productivity (For New Hires)
What it measures: How long it takes a new employee to ramp up.
Example: If a sales rep takes 3 months to hit quota, that’s their “time to productivity.”
Why it matters: Helps improve onboarding.
“Faster ramp-up = faster ROI on hiring.” — ActivTrak
5. Employee Utilization Rate
What it measures: % of paid hours spent on productive work.
Formula: (Productive Hours ÷ Total Hours Worked) x 100
Example: An employee logs 30 productive hours out of 40 → 75% utilization.
Why it matters: Prevents burnout and underutilization.
(Fun Fact: The “ideal” utilization rate is around 70%—higher leads to burnout.)
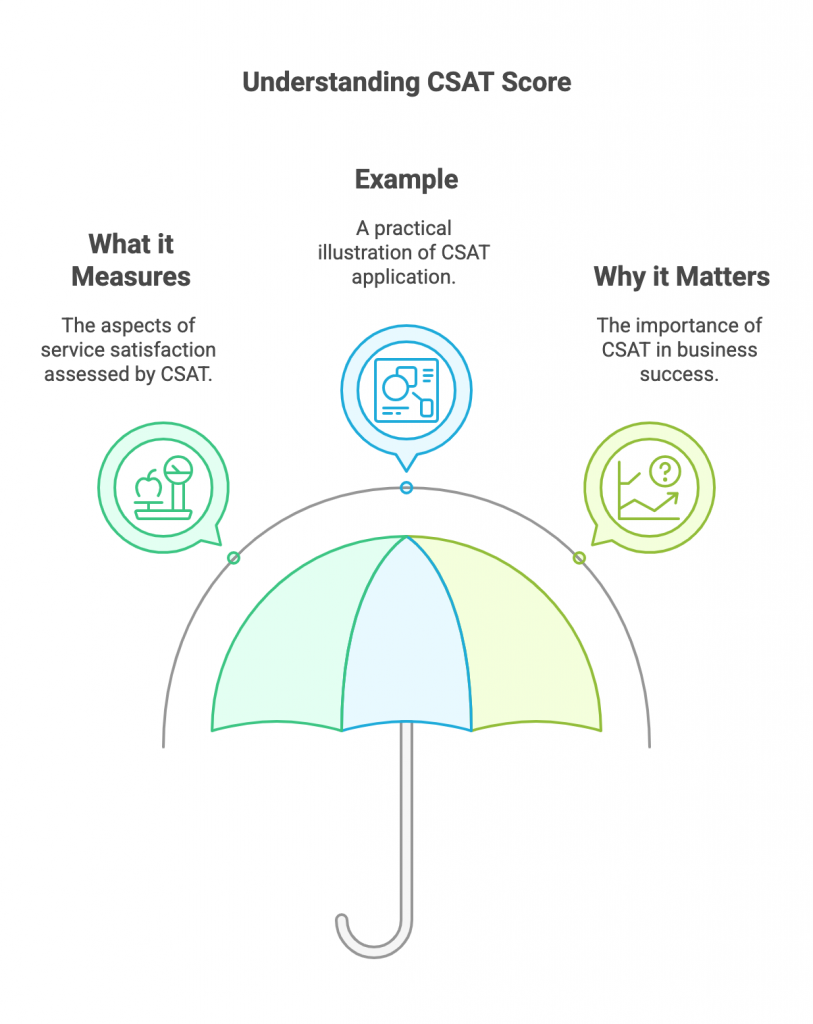
6. Customer Satisfaction (CSAT) Score
What it measures: How happy customers are with your service.
Example: After a support call, customers rate satisfaction 1-5. Averages below 4.0 signal issues.
Why it matters: Happy customers = repeat business.
7. Downtime Percentage
What it measures: Time lost due to inefficiencies (meetings, tech issues, etc.).
Example: A team spends 15 hours/week in meetings out of 40 total hours → 37.5% downtime.
Fix it: Audit meetings with tools like Clockify.
8. Labor Productivity Ratio
What it measures: Output relative to labor input.
Formula: Total Output ÷ Total Labor Hours
Example: A bakery produces 500 pastries with 50 labor hours → 10 pastries/hour.
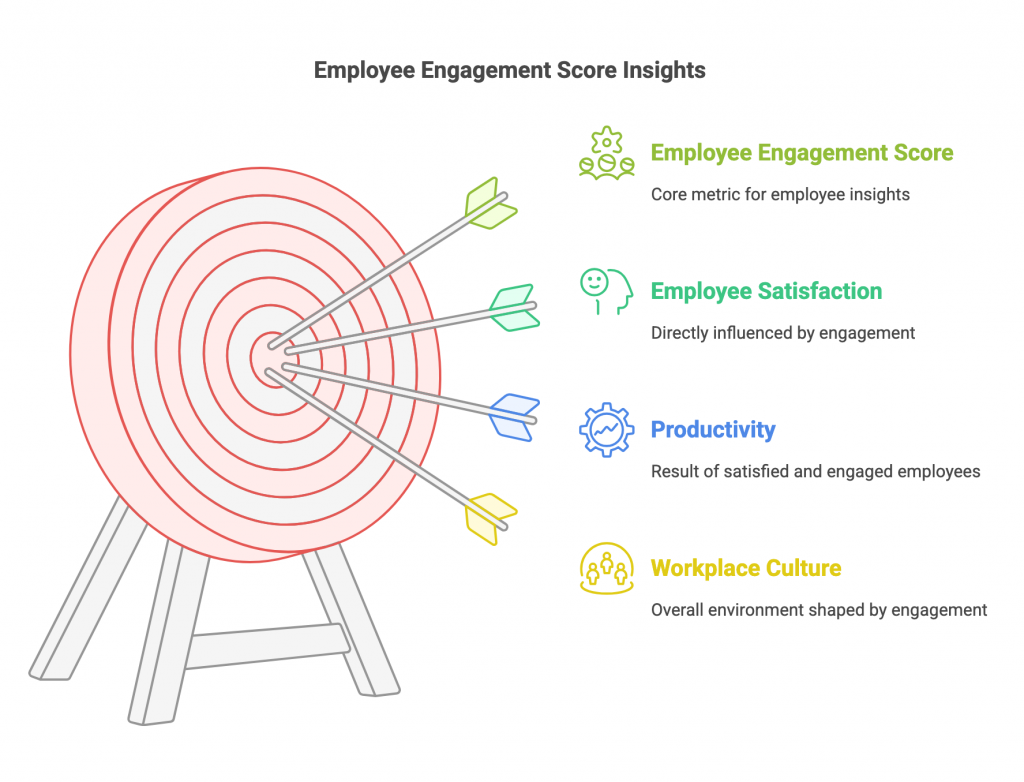
9. Employee Engagement Score
What it measures: How motivated and committed employees are.
Track via: Surveys, retention rates, eNPS (Employee Net Promoter Score).
Why it matters: Disengaged employees are 18% less productive (Gallup).
10. Agile Team Velocity
What it measures: Work completed per sprint (for dev teams).
Example: A team finishes 20 story points in Sprint 1 vs. 25 in Sprint 2 → 25% increase in velocity.
11. Overtime Hours
What it measures: Unplanned extra work hours.
Red flag: Consistent overtime = poor workload balance.
Solution: Redistribute tasks or hire more staff.
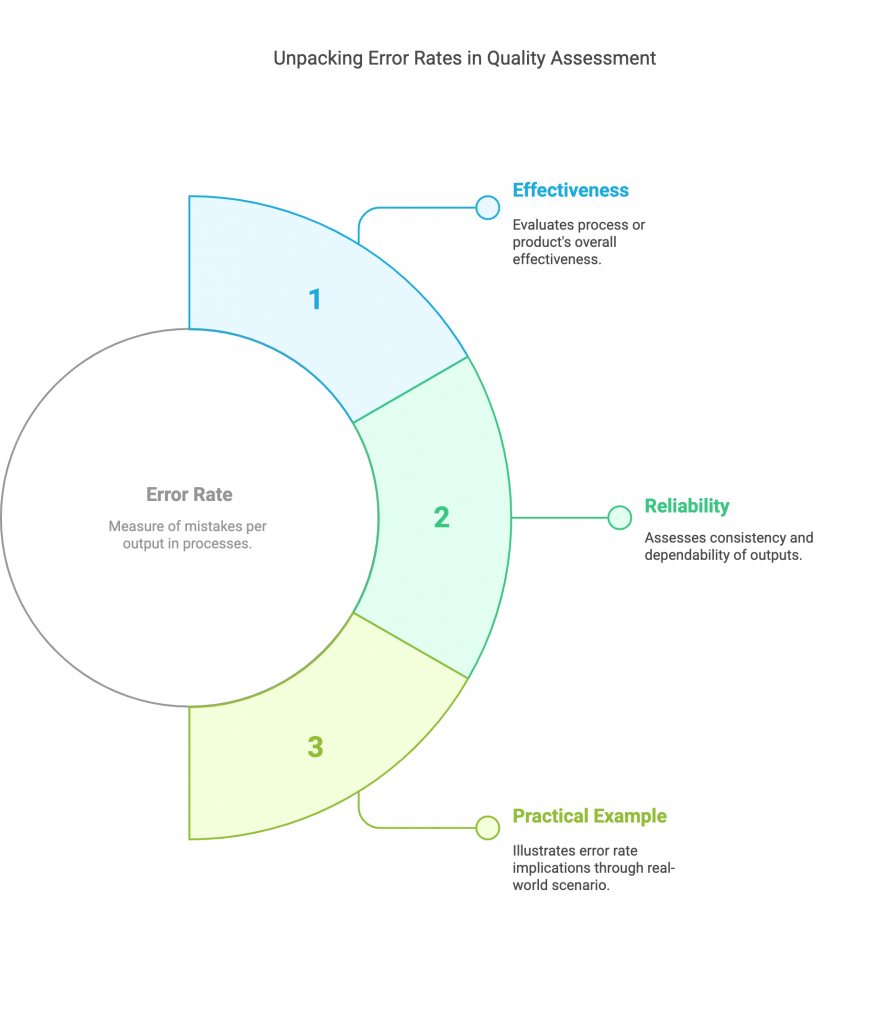
12. Quality vs. Quantity (Error Rate)
What it measures: Mistakes per output (e.g., bugs in code, customer complaints).
Example: A writer submits 10 articles with 3 major edits needed → 30% error rate.
Final Thoughts: How to Use These Metrics
Tracking productivity isn’t about micromanaging—it’s about working smarter. Start with 2-3 metrics that align with your goals, then expand.
Need a cheat sheet? Here’s a quick recap:
| Metric | Best For | Tool to Track It |
|---|---|---|
| Output per hour | Manufacturing | Time Doctor |
| Revenue per employee | Startups | QuickBooks |
| Task completion rate | Project teams | Asana/Trello |
Now it’s your turn: Which metric will you track first? Drop a comment or tweet me [@YourHandle].