
Why Measuring Productivity Matters
Ever feel like you’re working hard but not actually getting anywhere? You’re not alone. In today’s fast-paced work environment, busy ≠ productive.
That’s where productivity metrics come in. These measurable indicators help you (and your team) understand:
-
What’s working (so you can do more of it).
-
What’s not (so you can fix it).
-
How to optimize workflows for better results.
But with so many metrics out there, which ones actually matter? Below, I’ll break down 12 key productivity metrics—with real-world examples—to help you work smarter, not harder.
1. Output Per Hour (Or Per Employee)
What it measures: How much work is completed in a given time.
-
Example: If a customer service rep handles 50 tickets in an 8-hour shift, their output per hour is 6.25 tickets/hour.
-
Why it matters: Identifies top performers and bottlenecks.
-
Best for: Manufacturing, sales, customer support.
“Output per hour is the bread and butter of productivity tracking—it’s simple but powerful.” — Mosaic
2. Revenue Per Employee
What it measures: How much money each employee generates.
-
Formula: Total Revenue ÷ Number of Employees
-
Example: A startup with 1Mrevenueand10employees∗∗=∗∗1Mrevenueand10employees∗∗=∗∗100K per employee.
-
Why it matters: Shows if your team is scaling efficiently.
(Pro Tip: Compare this to industry benchmarks—tech companies average $200K+ per employee.)
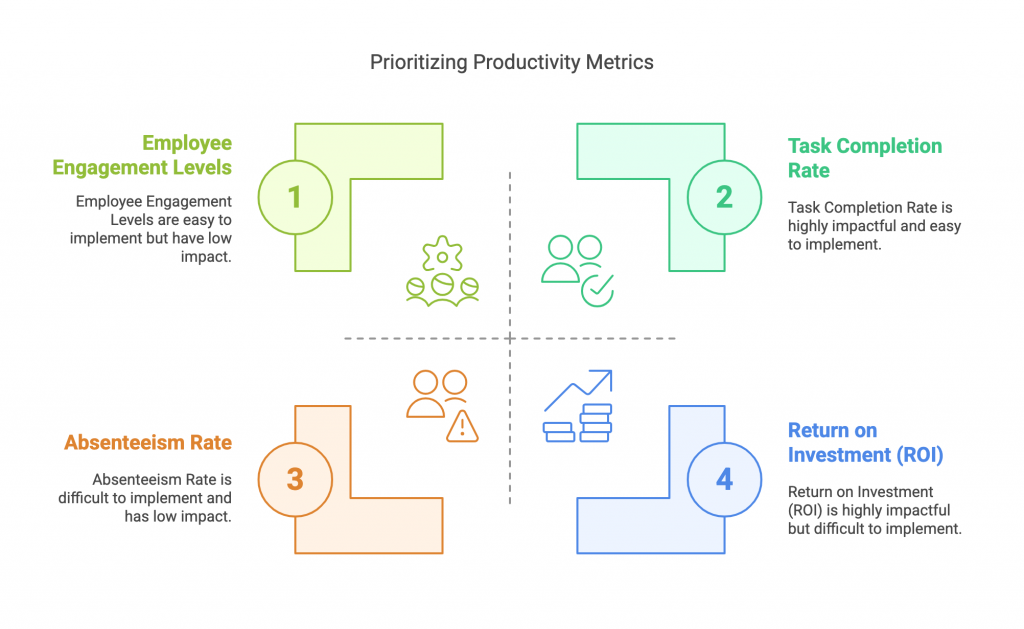
3. Task Completion Rate
What it measures: Percentage of tasks finished on time.
-
Example: A developer completes 18 out of 20 assigned tasks this week → 90% completion rate.
-
Why it matters: Uncovers workflow inefficiencies.
| Role | High Performance | Needs Improvement |
|---|---|---|
| Marketing Manager | 85%+ | Below 70% |
| Software Engineer | 90%+ | Below 75% |
4. Time to Productivity (For New Hires)
What it measures: How long it takes a new employee to ramp up.
-
Example: If a sales rep takes 3 months to hit quota, that’s their “time to productivity.”
-
Why it matters: Helps improve onboarding.
“Faster ramp-up = faster ROI on hiring.” — ActivTrak
5. Employee Utilization Rate
What it measures: % of paid hours spent on productive work.
-
Formula: (Productive Hours ÷ Total Hours Worked) x 100
-
Example: An employee logs 30 productive hours out of 40 → 75% utilization.
-
Why it matters: Prevents burnout and underutilization.
(Fun Fact: The “ideal” utilization rate is around 70%—higher leads to burnout.)
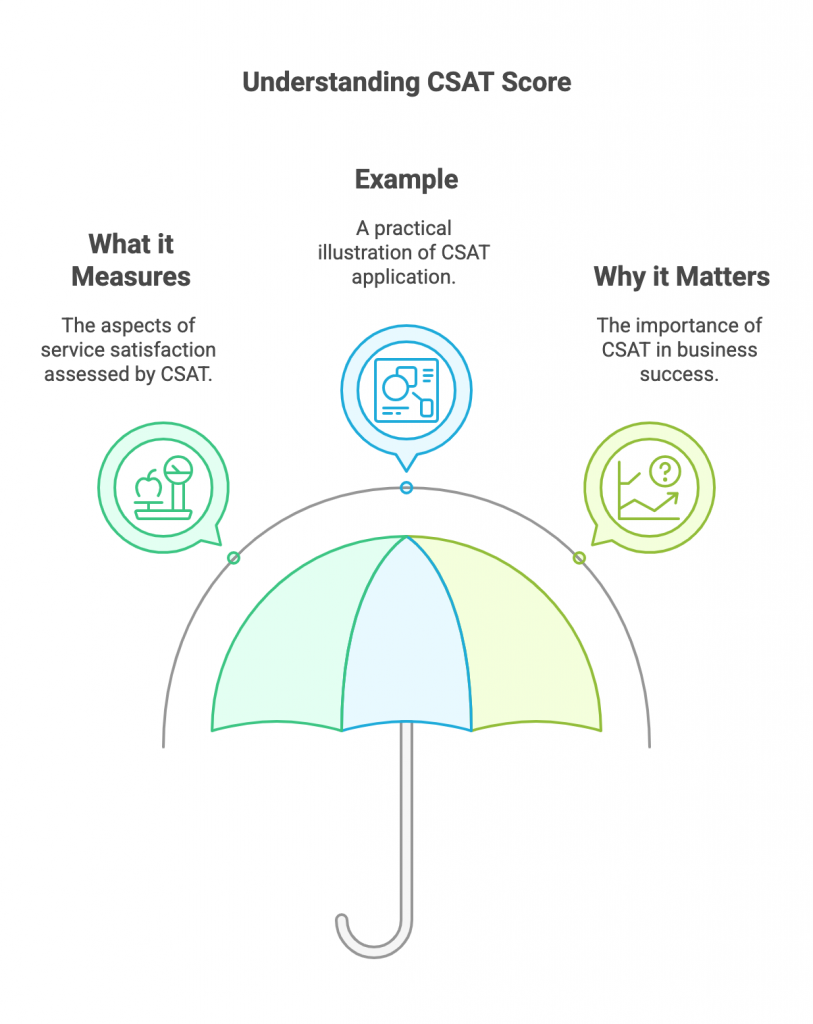
6. Customer Satisfaction (CSAT) Score
What it measures: How happy customers are with your service.
-
Example: After a support call, customers rate satisfaction 1-5. Averages below 4.0 signal issues.
-
Why it matters: Happy customers = repeat business.
7. Downtime Percentage
What it measures: Time lost due to inefficiencies (meetings, tech issues, etc.).
-
Example: A team spends 15 hours/week in meetings out of 40 total hours → 37.5% downtime.
-
Fix it: Audit meetings with tools like Clockify.
8. Labor Productivity Ratio
What it measures: Output relative to labor input.
-
Formula: Total Output ÷ Total Labor Hours
-
Example: A bakery produces 500 pastries with 50 labor hours → 10 pastries/hour.
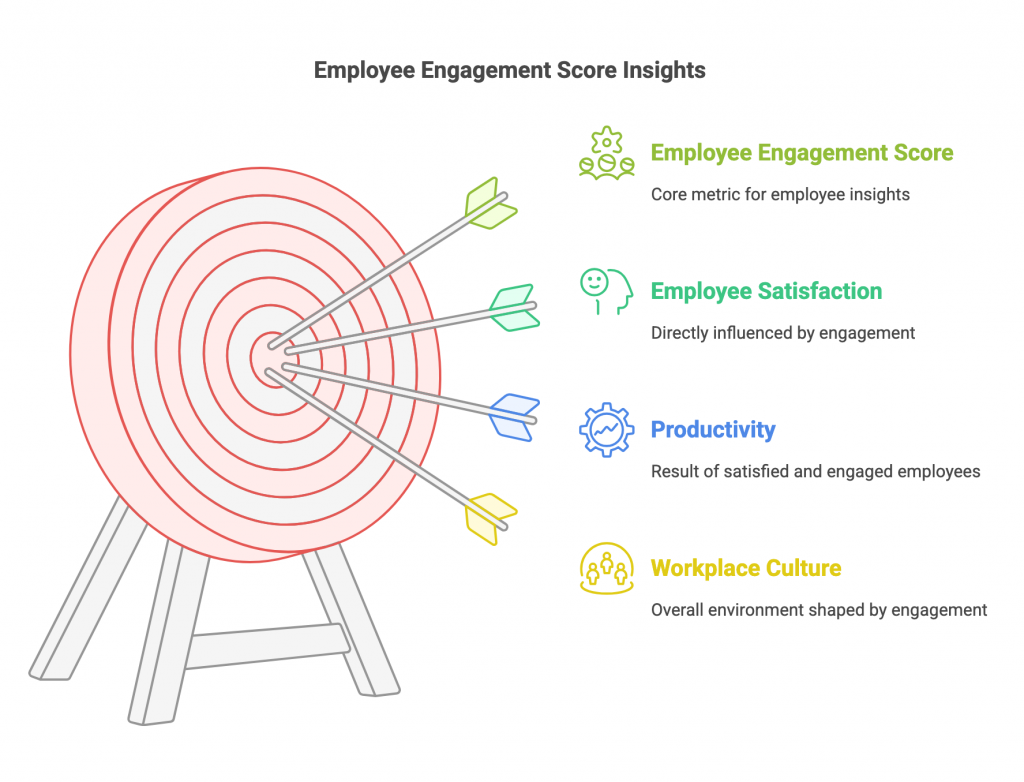
9. Employee Engagement Score
What it measures: How motivated and committed employees are.
-
Track via: Surveys, retention rates, eNPS (Employee Net Promoter Score).
-
Why it matters: Disengaged employees are 18% less productive (Gallup).
10. Agile Team Velocity
What it measures: Work completed per sprint (for dev teams).
-
Example: A team finishes 20 story points in Sprint 1 vs. 25 in Sprint 2 → 25% increase in velocity.
11. Overtime Hours
What it measures: Unplanned extra work hours.
-
Red flag: Consistent overtime = poor workload balance.
-
Solution: Redistribute tasks or hire more staff.
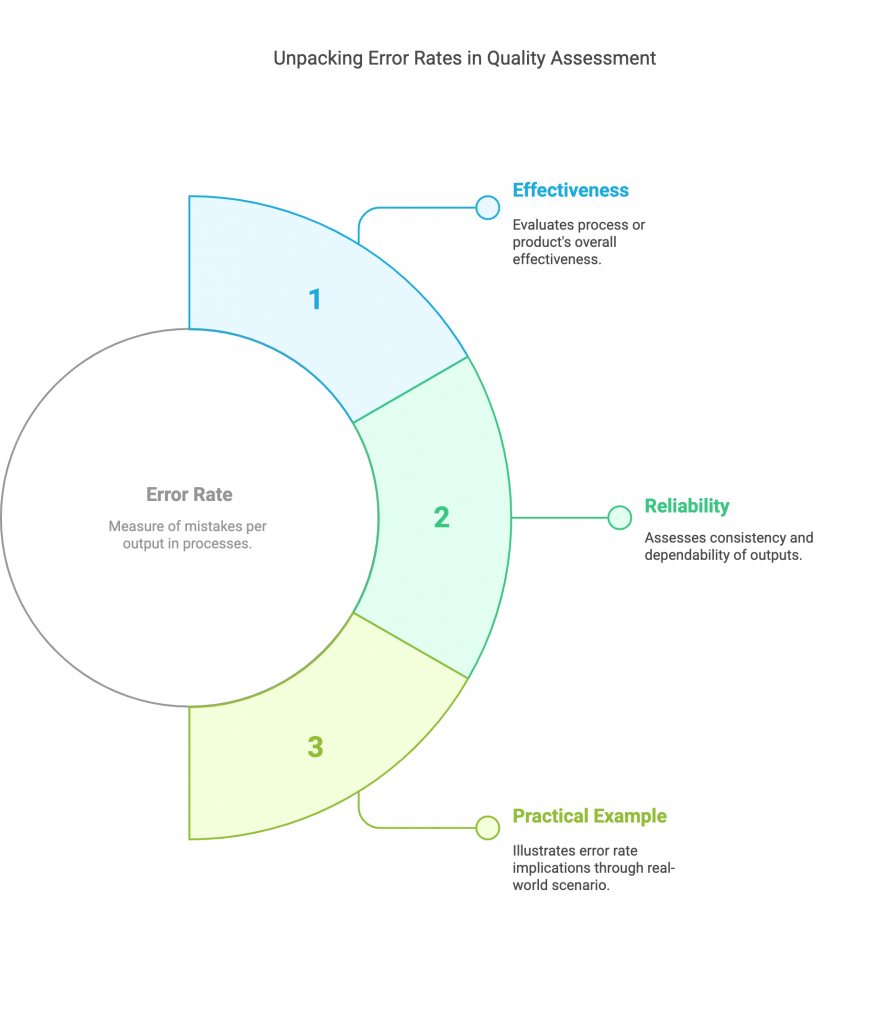
12. Quality vs. Quantity (Error Rate)
What it measures: Mistakes per output (e.g., bugs in code, customer complaints).
-
Example: A writer submits 10 articles with 3 major edits needed → 30% error rate.
Final Thoughts: How to Use These Metrics
Tracking productivity isn’t about micromanaging—it’s about working smarter. Start with 2-3 metrics that align with your goals, then expand.
Need a cheat sheet? Here’s a quick recap:
| Metric | Best For | Tool to Track It |
|---|---|---|
| Output per hour | Manufacturing | Time Doctor |
| Revenue per employee | Startups | QuickBooks |
| Task completion rate | Project teams | Asana/Trello |
Now it’s your turn: Which metric will you track first? Drop a comment or tweet me [@YourHandle].
Sources & Further Reading: